


Minnehaha County, South Dakota
About
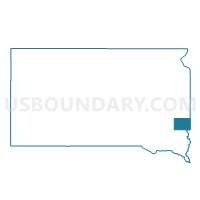
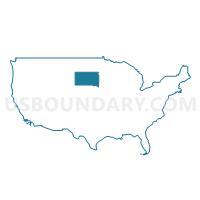
Outline

Summary
| Unique Area Identifier | 121503 |
| Name | Minnehaha County |
| State | South Dakota |
| Area (square miles) | 813.86 |
| Land Area (square miles) | 807.15 |
| Water Area (square miles) | 6.72 |
| % of Land Area | 99.17 |
| % of Water Area | 0.83 |
| Latitude of the Internal Point | 43.66747230 |
| Longtitude of the Internal Point | -96.79572610 |
| Total Population | 169,468 |
| Total Housing Units | 71,557 |
| Total Households | 67,028 |
| Median Age | 34.5 |
Maps
Graphs
Select a template below for downloading or customizing gragh for Minnehaha County, South Dakota


Neighbors
Neighoring County (by Name) Neighboring County on the Map
- Lake County, SD
- Lincoln County, SD
- Lyon County, IA
- McCook County, SD
- Moody County, SD
- Pipestone County, MN
- Rock County, MN
- Turner County, SD
County Subdivision in Minnehaha County (by Name) Neighboring County Subdivision on the Map
- Baltic city, Minnehaha County, SD
- Benton township, Minnehaha County, SD
- Brandon township, Minnehaha County, SD
- Brandon city, Minnehaha County, SD
- Buffalo township, Minnehaha County, SD
- Burk township, Minnehaha County, SD
- Clear Lake township, Minnehaha County, SD
- Colton city, Minnehaha County, SD
- Crooks city, Minnehaha County, SD
- Dell Rapids city, Minnehaha County, SD
- Dell Rapids township, Minnehaha County, SD
- Edison township, Minnehaha County, SD
- Garretson city, Minnehaha County, SD
- Grand Meadow township, Minnehaha County, SD
- Hartford city, Minnehaha County, SD
- Hartford township, Minnehaha County, SD
- Highland township, Minnehaha County, SD
- Humboldt town, Minnehaha County, SD
- Humboldt township, Minnehaha County, SD
- Logan township, Minnehaha County, SD
- Lyons township, Minnehaha County, SD
- Mapleton township, Minnehaha County, SD
- Palisade township, Minnehaha County, SD
- Red Rock township, Minnehaha County, SD
- Sherman town, Minnehaha County, SD
- Sioux Falls city, Minnehaha County, SD
- Split Rock township, Minnehaha County, SD
- Sverdrup township, Minnehaha County, SD
- Taopi township, Minnehaha County, SD
- Valley Springs city, Minnehaha County, SD
- Valley Springs township, Minnehaha County, SD
- Wall Lake township, Minnehaha County, SD
- Wayne township, Minnehaha County, SD
- Wellington township, Minnehaha County, SD
Top 10 Neighboring Place (by Population) Neighboring Place on the Map
- Sioux Falls city, SD (153,888)
- Brandon city, SD (8,785)
- Dell Rapids city, SD (3,633)
- Hartford city, SD (2,534)
- Crooks city, SD (1,269)
- Garretson city, SD (1,166)
- Baltic city, SD (1,089)
- Valley Springs city, SD (759)
- Colton city, SD (687)
- Humboldt town, SD (589)
Top 10 Neighboring Unified School District (by Population) Neighboring Unified School District on the Map
- Sioux Falls School District 49-5, SD (143,629)
- Brandon Valley School District 49-2, SD (16,026)
- Harrisburg School District 41-2, SD (15,963)
- Madison Central School District 39-2, SD (8,762)
- Pipestone Area School District, MN (7,718)
- West Central School District 49-7, SD (6,058)
- Lennox School District 41-4, SD (5,988)
- Canton School District 41-1, SD (5,582)
- Dell Rapids School District 49-3, SD (5,508)
- Tea Area School District 41-5, SD (5,408)
Top 10 Neighboring State Legislative District Lower Chamber (by Population) Neighboring State Legislative District Lower Chamber on the Map
- State House District 10, SD (35,025)
- State House District 22A, MN (34,781)
- State House District 4, IA (30,923)
- State House District 11, SD (30,071)
- State House District 12, SD (29,821)
- State House District 9, SD (29,046)
- State House District 14, SD (24,426)
- State House District 25, SD (22,548)
- State House District 13, SD (21,646)
- State House District 15, SD (21,169)
Top 10 Neighboring State Legislative District Upper Chamber (by Population) Neighboring State Legislative District Upper Chamber on the Map
- State Senate District 22, MN (71,339)
- State Senate District 2, IA (60,664)
- State Senate District 10, SD (35,025)
- State Senate District 11, SD (30,071)
- State Senate District 12, SD (29,821)
- State Senate District 9, SD (29,046)
- State Senate District 14, SD (24,426)
- State Senate District 25, SD (22,548)
- State Senate District 13, SD (21,646)
- State Senate District 15, SD (21,169)
Top 10 Neighboring 111th Congressional District (by Population) Neighboring 111th Congressional District on the Map
- Congressional District (at Large), SD (814,180)
- Congressional District 1, MN (644,787)
- Congressional District 5, IA (577,453)
Top 10 Census Tract in Minnehaha County (by Population) Neighboring Census Tract on the Map
- Census Tract 11.06, Minnehaha County, SD (9,727)
- Census Tract 18.03, Minnehaha County, SD (6,580)
- Census Tract 18.01, Minnehaha County, SD (6,493)
- Census Tract 11.05, Minnehaha County, SD (6,085)
- Census Tract 15, Minnehaha County, SD (5,648)
- Census Tract 103, Minnehaha County, SD (5,590)
- Census Tract 106, Minnehaha County, SD (5,306)
- Census Tract 19.02, Minnehaha County, SD (5,182)
- Census Tract 1, Minnehaha County, SD (5,174)
- Census Tract 105.01, Minnehaha County, SD (4,957)
Top 10 Neighboring 5-Digit ZIP Code Tabulation Area (by Population) Neighboring 5-Digit ZIP Code Tabulation Area on the Map
- 57106, SD (39,852)
- 57103, SD (34,480)
- 57104, SD (25,901)
- 57105, SD (22,268)
- 57108, SD (17,267)
- 57110, SD (12,309)
- 57005, SD (10,473)
- 57042, SD (8,415)
- 57107, SD (8,044)
- 57064, SD (5,072)
Data
Demographic, Population, Households, and Housing Units
** Data sources from census 2010 **
Show Data on Map
Download Full List as CSV
Download Quick Sheet as CSV
| Subject | This Area | South Dakota | National |
|---|---|---|---|
| POPULATION | |||
| Total Population Map | 169,468 | 814,180 | 308,745,538 |
| POPULATION, HISPANIC OR LATINO ORIGIN | |||
| Not Hispanic or Latino Map | 162,486 | 792,061 | 258,267,944 |
| Hispanic or Latino Map | 6,982 | 22,119 | 50,477,594 |
| POPULATION, RACE | |||
| White alone Map | 149,220 | 699,392 | 223,553,265 |
| Black or African American alone Map | 6,407 | 10,207 | 38,929,319 |
| American Indian and Alaska Native alone Map | 4,197 | 71,817 | 2,932,248 |
| Asian alone Map | 2,509 | 7,610 | 14,674,252 |
| Native Hawaiian and Other Pacific Islander alone Map | 133 | 394 | 540,013 |
| Some Other Race alone Map | 3,114 | 7,477 | 19,107,368 |
| Two or More Races Map | 3,888 | 17,283 | 9,009,073 |
| POPULATION, SEX | |||
| Male Map | 84,537 | 407,381 | 151,781,326 |
| Female Map | 84,931 | 406,799 | 156,964,212 |
| POPULATION, AGE (18 YEARS) | |||
| 18 years and over Map | 126,905 | 611,383 | 234,564,071 |
| Under 18 years | 42,563 | 202,797 | 74,181,467 |
| POPULATION, AGE | |||
| Under 5 years | 12,914 | 59,621 | 20,201,362 |
| 5 to 9 years | 11,702 | 55,531 | 20,348,657 |
| 10 to 14 years | 11,111 | 53,960 | 20,677,194 |
| 15 to 17 years | 6,836 | 33,685 | 12,954,254 |
| 18 and 19 years | 4,589 | 23,943 | 9,086,089 |
| 20 years | 2,367 | 11,907 | 4,519,129 |
| 21 years | 2,431 | 11,739 | 4,354,294 |
| 22 to 24 years | 7,645 | 33,950 | 12,712,576 |
| 25 to 29 years | 14,118 | 55,570 | 21,101,849 |
| 30 to 34 years | 12,182 | 49,859 | 19,962,099 |
| 35 to 39 years | 10,851 | 45,766 | 20,179,642 |
| 40 to 44 years | 10,959 | 47,346 | 20,890,964 |
| 45 to 49 years | 12,673 | 57,519 | 22,708,591 |
| 50 to 54 years | 11,862 | 59,399 | 22,298,125 |
| 55 to 59 years | 10,265 | 54,231 | 19,664,805 |
| 60 and 61 years | 3,592 | 18,999 | 7,113,727 |
| 62 to 64 years | 4,528 | 24,574 | 9,704,197 |
| 65 and 66 years | 2,388 | 13,621 | 5,319,902 |
| 67 to 69 years | 3,095 | 18,323 | 7,115,361 |
| 70 to 74 years | 4,057 | 25,683 | 9,278,166 |
| 75 to 79 years | 3,433 | 21,724 | 7,317,795 |
| 80 to 84 years | 2,904 | 18,004 | 5,743,327 |
| 85 years and over | 2,966 | 19,226 | 5,493,433 |
| MEDIAN AGE BY SEX | |||
| Both sexes Map | 34.50 | 36.90 | 37.20 |
| Male Map | 33.50 | 35.60 | 35.80 |
| Female Map | 35.60 | 38.20 | 38.50 |
| HOUSEHOLDS | |||
| Total Households Map | 67,028 | 322,282 | 116,716,292 |
| HOUSEHOLDS, HOUSEHOLD TYPE | |||
| Family households: Map | 42,052 | 206,964 | 77,538,296 |
| Husband-wife family Map | 31,988 | 161,617 | 56,510,377 |
| Other family: Map | 10,064 | 45,347 | 21,027,919 |
| Male householder, no wife present Map | 3,004 | 14,233 | 5,777,570 |
| Female householder, no husband present Map | 7,060 | 31,114 | 15,250,349 |
| Nonfamily households: Map | 24,976 | 115,318 | 39,177,996 |
| Householder living alone Map | 19,631 | 94,638 | 31,204,909 |
| Householder not living alone Map | 5,345 | 20,680 | 7,973,087 |
| HOUSEHOLDS, HISPANIC OR LATINO ORIGIN OF HOUSEHOLDER | |||
| Not Hispanic or Latino householder: Map | 65,305 | 316,719 | 103,254,926 |
| Hispanic or Latino householder: Map | 1,723 | 5,563 | 13,461,366 |
| HOUSEHOLDS, RACE OF HOUSEHOLDER | |||
| Householder who is White alone | 61,938 | 292,219 | 89,754,352 |
| Householder who is Black or African American alone | 1,841 | 3,029 | 14,129,983 |
| Householder who is American Indian and Alaska Native alone | 1,052 | 18,966 | 939,707 |
| Householder who is Asian alone | 705 | 2,199 | 4,632,164 |
| Householder who is Native Hawaiian and Other Pacific Islander alone | 38 | 111 | 143,932 |
| Householder who is Some Other Race alone | 797 | 2,014 | 4,916,427 |
| Householder who is Two or More Races | 657 | 3,744 | 2,199,727 |
| HOUSEHOLDS, HOUSEHOLD TYPE BY HOUSEHOLD SIZE | |||
| Family households: Map | 42,052 | 206,964 | 77,538,296 |
| 2-person household Map | 18,461 | 99,234 | 31,882,616 |
| 3-person household Map | 9,393 | 41,815 | 17,765,829 |
| 4-person household Map | 8,270 | 36,252 | 15,214,075 |
| 5-person household Map | 3,825 | 18,345 | 7,411,997 |
| 6-person household Map | 1,382 | 6,918 | 3,026,278 |
| 7-or-more-person household Map | 721 | 4,400 | 2,237,501 |
| Nonfamily households: Map | 24,976 | 115,318 | 39,177,996 |
| 1-person household Map | 19,631 | 94,638 | 31,204,909 |
| 2-person household Map | 4,268 | 16,441 | 6,360,012 |
| 3-person household Map | 733 | 2,758 | 992,156 |
| 4-person household Map | 250 | 1,019 | 411,171 |
| 5-person household Map | 65 | 303 | 126,634 |
| 6-person household Map | 20 | 95 | 48,421 |
| 7-or-more-person household Map | 9 | 64 | 34,693 |
| HOUSING UNITS | |||
| Total Housing Units Map | 71,557 | 363,438 | 131,704,730 |
| HOUSING UNITS, OCCUPANCY STATUS | |||
| Occupied Map | 67,028 | 322,282 | 116,716,292 |
| Vacant Map | 4,529 | 41,156 | 14,988,438 |
| HOUSING UNITS, OCCUPIED, TENURE | |||
| Owned with a mortgage or a loan Map | 32,558 | 133,814 | 52,979,430 |
| Owned free and clear Map | 11,009 | 85,744 | 23,006,644 |
| Renter occupied Map | 23,461 | 102,724 | 40,730,218 |
| HOUSING UNITS, VACANT, VACANCY STATUS | |||
| For rent Map | 2,690 | 10,366 | 4,137,567 |
| Rented, not occupied Map | 79 | 642 | 206,825 |
| For sale only Map | 645 | 3,696 | 1,896,796 |
| Sold, not occupied Map | 136 | 1,314 | 421,032 |
| For seasonal, recreational, or occasional use Map | 214 | 13,277 | 4,649,298 |
| For migrant workers Map | 0 | 88 | 24,161 |
| Other vacant Map | 765 | 11,773 | 3,652,759 |
| HOUSING UNITS, OCCUPIED, AVERAGE HOUSEHOLD SIZE BY TENURE | |||
| Total: Map | 2.43 | 2.42 | 2.58 |
| Owner occupied Map | 2.62 | 2.53 | 2.65 |
| Renter occupied Map | 2.09 | 2.18 | 2.44 |
| HOUSING UNITS, OCCUPIED, TENURE BY RACE OF HOUSEHOLDER | |||
| Owner occupied: Map | 43,567 | 219,558 | 75,986,074 |
| Householder who is White alone Map | 42,078 | 208,007 | 63,446,275 |
| Householder who is Black or African American alone Map | 387 | 747 | 6,261,464 |
| Householder who is American Indian and Alaska Native alone Map | 175 | 7,391 | 509,588 |
| Householder who is Asian alone Map | 340 | 958 | 2,688,861 |
| Householder who is Native Hawaiian and Other Pacific Islander alone Map | 20 | 50 | 61,911 |
| Householder who is Some Other Race alone Map | 339 | 753 | 1,975,817 |
| Householder who is Two or More Races Map | 228 | 1,652 | 1,042,158 |
| Renter occupied: Map | 23,461 | 102,724 | 40,730,218 |
| Householder who is White alone Map | 19,860 | 84,212 | 26,308,077 |
| Householder who is Black or African American alone Map | 1,454 | 2,282 | 7,868,519 |
| Householder who is American Indian and Alaska Native alone Map | 877 | 11,575 | 430,119 |
| Householder who is Asian alone Map | 365 | 1,241 | 1,943,303 |
| Householder who is Native Hawaiian and Other Pacific Islander alone Map | 18 | 61 | 82,021 |
| Householder who is Some Other Race alone Map | 458 | 1,261 | 2,940,610 |
| Householder who is Two or More Races Map | 429 | 2,092 | 1,157,569 |
| HOUSING UNITS, OCCUPIED, TENURE BY HISPANIC OR LATINO ORIGIN OF HOUSEHOLDER | |||
| Owner occupied: Map | 43,567 | 219,558 | 75,986,074 |
| Not Hispanic or Latino householder Map | 42,825 | 217,277 | 69,617,625 |
| Hispanic or Latino householder Map | 742 | 2,281 | 6,368,449 |
| Renter occupied: Map | 23,461 | 102,724 | 40,730,218 |
| Not Hispanic or Latino householder Map | 22,480 | 99,442 | 33,637,301 |
| Hispanic or Latino householder Map | 981 | 3,282 | 7,092,917 |
| HOUSING UNITS, OCCUPIED, TENURE BY HOUSEHOLD SIZE | |||
| Owner occupied: Map | 43,567 | 219,558 | 75,986,074 |
| 1-person household Map | 8,862 | 48,035 | 16,453,569 |
| 2-person household Map | 16,528 | 89,722 | 27,618,605 |
| 3-person household Map | 7,095 | 31,852 | 12,517,563 |
| 4-person household Map | 6,690 | 28,667 | 10,998,793 |
| 5-person household Map | 2,953 | 13,866 | 5,057,765 |
| 6-person household Map | 984 | 4,880 | 1,965,796 |
| 7-or-more-person household Map | 455 | 2,536 | 1,373,983 |
| Renter occupied: Map | 23,461 | 102,724 | 40,730,218 |
| 1-person household Map | 10,769 | 46,603 | 14,751,340 |
| 2-person household Map | 6,201 | 25,953 | 10,624,023 |
| 3-person household Map | 3,031 | 12,721 | 6,240,422 |
| 4-person household Map | 1,830 | 8,604 | 4,626,453 |
| 5-person household Map | 937 | 4,782 | 2,480,866 |
| 6-person household Map | 418 | 2,133 | 1,108,903 |
| 7-or-more-person household Map | 275 | 1,928 | 898,211 |
Loading...